Voyant is web-based text-mining tool that allows a user to visually analyze a collection (which in Voyant is called a corpus) of text documents. It can be found at http://voyant-tools.org. While it might seem confusing or hard to use at first, once you have spent a little time exploring its features and seeing how it works, you will be glad you did. It only takes a few example searches to see how useful it can be as a text analysis tool. In my case, I performed several example searches using transcripts of the WPA Slave Narratives provided by Project Guttenberg as my corpus of literature. On Voyant’s home page, it is easy to paste in a full text for analysis (if you are looking to analyze one document) or you can upload multiple documents or add URL links to text files. Once you do that and click the reveal key, the real magic begins.
There are many different ways to analyze your texts. The first feature is called Cirrus. It creates a text cloud which is a visual representation of the most commonly used words in your document or corpus of text. By clicking the small gear icon in the top corner, you can easily filter out all of the normal day-to-day English words (like is, was, he, she, the, it, etc.) so that your text cloud is more interesting and reveals the key terms or subjects from your corpus. While working with the slave narratives, I additionally had to filter out other “everyday words” like “dem” and “dat” that are common in the slave narratives. After doing that, I was left with a very interesting collection of words: old, come, white, good, man, master, folks, plantation, time, slaves, n—–(s), master/marster, died, like, little, mammy, colored and house. By hovering over any of the words, you can see how many times they occur in your corpus of literature.
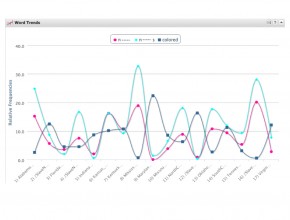
Another fascinating tool in Voyant is the Word Trends tool. You can pick out different words from your word cloud and have Voyant graph them visually to see how their usage changes in the different documents in your corpus. You can graph multiple words simultaneously and compare their usage. In my example, I decided to compare two words used at the time to describe African Americans: “colored” and “n—–(s).” Voyant provided me with a graph that showed the number of occurrences of both words in each of my documents (which each corresponded to a different state where the former slave was interviewed).

As you can see from the graph, the results were quite interesting. The states whose slave narratives overwhelming used the word “n—–(s)” were: Alabama, Georgia, Kansas, Mississippi, North Carolina, Oklahoma, and Texas. The states where the term “colored” was more often used were: Arkansas, Indiana, Ohio and Maryland. The two terms are found in about the same number of usage in slave narratives from Kentucky, Missouri, South Carolina, Tennessee, Virginia. The narratives from Florida, did not make much use of either term.
A student of history might not be too surprised with these findings, seeing as the term “n—-(s)” (which today is considered very derogatory) was found mostly in the deep South, or the new Southwest that was opened after the Louisiana Purchase. On the other hand, the term “colored” was used a lot in Ohio and Indiana, which had always been free land going back to the Northwest Territory. States where the two terms seem to have been used interchangeable were some of the border states (like Kentucky or Virginia). The two outliers that don’t seem to fit and would be worthy of closer examination are Florida and South Carolina (which one might think would fall with the other states of the deep south).
Voyant allows you to do that closer reading. By hovering over a data point, it shows you the number of instances of that term in a certain document and leads to a list of all of the instances of that term in the text, which you can click on see the terms in context in the Corpus Reader frame right next to the graph. While Voyant doesn’t prove any hard facts, it can give you interesting trends which can prompt research questions that you want to investigate further. (One must be careful though, to remember that the model is based on certain sources and does not represent the totality of evidence for a subject.)
For example, with my slave narrative example, I might want to further investigate the usage of those two terms in slave narratives from Florida and South Carolina to figure out why they do not fit with the trends from the other states. I might go back to Cirrus (the word cloud) or the Summary window to find out if there is another reverent term for African Americans that was missing from my original search. Or I might want to use the Corpus reader or the Keywords in Context frame to look at how those two terms are actually being used in the narratives. Are the interviewees using these terms to describe themselves or other slaves? Or are they are describing how their master referred to them? The possibilities for questions are endless.
While at first I was hesitant to embrace Voyant, I am now very impressed. First of all, its shear computational ability is amazing. But I think what is even more exciting for scholars, is the ability to visualize patterns which prompt new questions and directions for research. Voyant does not give you a final answer. Instead, it provides a jumping off point that, when the right questions are asked, may lead to an amazing discovery.